EG254S: IoT System Project - IoT Platforms

Creating My Very Own IoT Dashboards
With the help of IoT dashboards, the pest control company can view and (remotely) monitor the rat activities and the rat poison bait level from anywhere locally or in the world. The IoT dashboard is the key HMI (Human-Machine Interface) component that organizes and presents the data I have collected in my IoT data solution using MySQL database server on the Raspberry Pi.
How to Draw Bar Graph using Data from MySQL Table and PHP
(Adapted from: https://www.dyclassroom.com/chartjs/chartjs-how-to-draw-bar-graph-using-data-from-mysql-table-and-php)Let's draw two Bar Graphs, one for the rat activities and the other for the rat poison bait level, using the data from MySQL table and PHP.
Requirement
We will need the following items to complete this task.
- Text Editor like SublimeText, TextMate, Coda, NotePad++ (which I use) or IDE like Eclipse
- Web Browser like Chrome or Firefox
- PHP development environment on the Raspberry Pi. (For installation, we can refer to our lab sheet from previous modules.)
- MySQL (Refer to IoT Data using MySQL)
- ChartJS (Using ChartJS 2.x Download or download here.)
So lets get started...
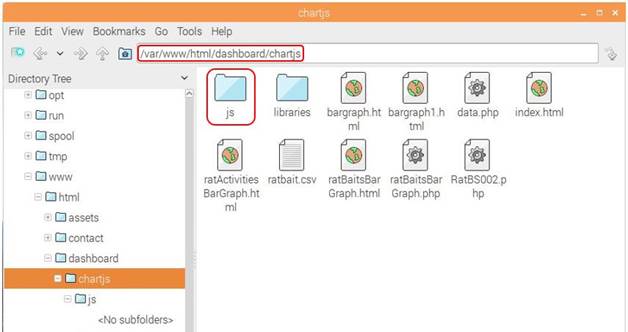
Create a New Folder
Create a new project folder and name it chartjs, which I had placed in the DocumentRoot that was set to /var/www/html by the Apache server on the Raspberry Pi. Inside the chartjs project folder create a subfolder and name it js. This will hold all the javascript files which was downloaded from above.
Create data.php file to fetch Data from MySQL Table
Create a new file data.php inside the chartjs folder. This file is going to contain php code that will fetch data from the score table and display it in JSON format.
We need to query MySQL database server to extract out two columns from the table: stationNo and ratCounter. The rows we want is the latest ratCounter from each stationNo in the table and the rows arranged in ascending order of the stationNo. This is the query statement for MySQL:
“SELECT stationNo, ratCounter FROM RatActivity AS t
CROSS JOIN ( SELECT stationNo, MAX(DateTime) AS DateTime FROM RatActivity GROUP BY stationNo )
AS sq USING (stationNo, DateTime) ORDER BY stationNo"
File: data.php
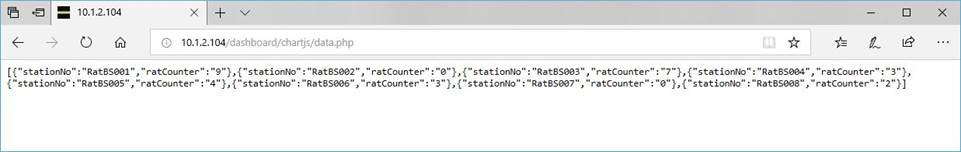
Output of data.php file
To get the output of data.php file, open it in your web browser
URL: localhost/chartjs/data.php
Writing the javascript in ratApp.js
We will be making AJAX call from ratApp.js file to data.php file to fetch the JSON data which will be used to draw the rat activities bar graph.
File: ratApp.js
$(document).ready(function(){
$.ajax({
url: "http://10.1.2.104/dashboard/chartjs/data.php",
method: "GET",
success: function(data) {
console.log(data);
var station = [];
var rat = [];
for(var i in data) {
station.push(data[i].stationNo);
rat.push(data[i].ratCounter);
}
var chartdata = {
labels: station,
datasets : [
{
label: 'Number of Rat Activity',
backgroundColor: 'rgba(186, 85, 211, 0.48)',
borderColor: 'rgba(186, 85, 211, 0.68)',
hoverBackgroundColor: 'rgba(186, 85, 211, 1)',
hoverBorderColor: 'rgba(186, 85, 211, 1)',
data: rat
}
]
};
var ctx = $("#mycanvas");
var barGraph = new Chart(ctx, {
type: 'bar',
data: chartdata
});
},
error: function(data) {
console.log(data);
}
});
});
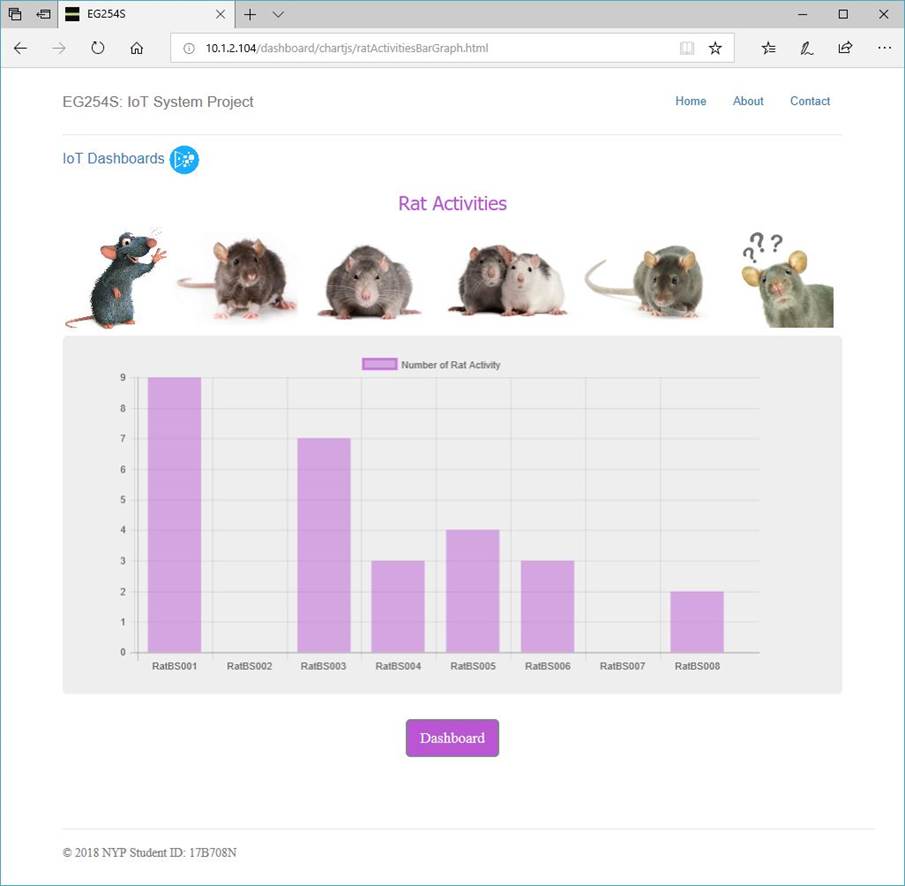
Create ratActivitiesBarGraph.html file to Display the Rat Activities Bar Graph
Now create a new file inside chartjs project folder and name it ratActivitiesBarGraph.html. This file is going to display the rat activities bar graph.
File: ratActivitiesBarGraph.html
<!DOCTYPE html>
<html lang="en">
<head>
<meta charset="utf-8">
<meta http-equiv="X-UA-Compatible" content="IE=edge">
<meta name="viewport" content="width=device-width, initial-scale=1">
<!-- The above 3 meta tags *must* come first in the head; any other head content must come *after* these tags -->
<meta name="description" content="">
<meta name="author" content="">
<link rel="icon" href="../images/favicon.ico">
<title>EG254S</title>
<!-- Bootstrap core CSS -->
<link href="../../dist/css/bootstrap.min.css" rel="stylesheet">
<!-- IE10 viewport hack for Surface/desktop Windows 8 bug -->
<link href="../../assets/css/ie10-viewport-bug-workaround.css" rel="stylesheet">
<!-- Custom styles for this template -->
<link href="../../jumbotron-narrow.css" rel="stylesheet">
<!-- Just for debugging purposes. Don't actually copy these 2 lines! -->
<!--[if lt IE 9]><script src="assets/js/ie8-responsive-file-warning.js"></script><![endif]-->
<script src="../../assets/js/ie-emulation-modes-warning.js"></script>
<!-- HTML5 shim and Respond.js for IE8 support of HTML5 elements and media queries -->
<!--[if lt IE 9]>
<script src="https://oss.maxcdn.com/html5shiv/3.7.2/html5shiv.min.js"></script>
<script src="https://oss.maxcdn.com/respond/1.4.2/respond.min.js"></script>
<![endif]-->
<style> td.padding {padding-left: 10px;} </style>
<style type="text/css">
#chart-container {
width: 780px;
height: auto;
}
</style>
</head>
<body>
<!-- javascript -->
<script type="text/javascript" src="js/jquery.min.js"></script>
<script type="text/javascript" src="js/Chart.min.js"></script>
<script type="text/javascript" src="js/ratApp.js"></script>
<div class="container">
<div class="header clearfix">
<nav>
<ul class="nav nav-pills pull-right">
<li role="presentation"><a href="../../index.html">Home</a></li>
<li role="presentation"><a href="../../about/index.html">About</a></li>
<li role="presentation"><a href="../../contact/index.html">Contact</a></li>
</ul>
</nav>
<h3 class="text-muted">EG254S: IoT System Project</h3>
</div>
<div class="padding" style="margin-bottom:0px;font-size:13pt">
<a href="../index.html">IoT Dashboards</a>
<img src="../../images/images.png" alt="IoT Dashboards"
style="vertical-align:text-center; height:38px"> </div>
<h2 style='text-align:center;font-weight: normal; color:mediumorchid;font-family:"Tahoma"'>
Rat Activities</h2>
<span><img src="../../images/rat-toe.png" alt="rats" style="width:130px">
<img src="../../images/rat.jpg" alt="rats" style="width:150px">
<img src="../../images/Blue-rat.jpg" alt="rats" style="width:160px">
<img src="../../images/rat-activities.png" alt="rats" style="width:160px">
<img src="../../images/rat02.jpg" alt="rats" style="width:180px">
<img src="../../images/B7.jpg" alt="rats" style="text-align:right;width:130px"></span>
<div class="jumbotron">
<table>
<tr>
<td style="min-width: 380px">
<div id="chart-container">
<canvas id="mycanvas"></canvas>
</div>
</td>
</tr>
</table>
</div>
<div style="text-align:center;margin-bottom:80px">
<p><a class="btn btn-lg btn-success" href="ratActivitiesBarGraph.html" role="button" style="text-align:center;background-color:mediumorchid ">
Dashboard</a></p>
</div>
<footer class="footer">
<f>© 2018 NYP Student ID: 17B708N</f>
</footer>
</div> <!-- /container -->
<!-- IE10 viewport hack for Surface/desktop Windows 8 bug -->
<script src="../../assets/js/ie10-viewport-bug-workaround.js"></script>
</body>
</html>
Output
Writing the javascript in baitApp.js
We will be making AJAX call from baitApp.js file to data.php file to fetch the JSON data which will be used to draw the rat poison bait level bar graph. The data fetched had to be manipulated to reflect the rat bait level left.
File: baitApp.js
$(document).ready(function(){
$.ajax({
url: "http://10.1.2.104/dashboard/chartjs/data.php",
method: "GET",
success: function(data) {
console.log(data);
var station = [];
var rats = [];
for(var i in data) {
station.push(data[i].stationNo);
rats.push(data[i].ratCounter);
}
var baits = [];
for(var i = 0; i < rats.length; i++) {
baits.push((10 - rats[i]) * 10);
}
var chartdata = {
labels: station,
datasets : [
{
label: 'Poison Bait Level (%)',
backgroundColor: 'rgba(34, 139, 34, 0.48)',
borderColor: 'rgba(34, 139, 34, 0.48)',
hoverBackgroundColor: 'rgba(34, 139, 34, 1)',
hoverBorderColor: 'rgba(34, 139, 34, 1)',
data: baits
}
]
};
var ctx = $("#mycanvas");
var barGraph = new Chart(ctx, {
type: 'bar',
data: chartdata
});
},
error: function(data) {
console.log(data);
}
});
});
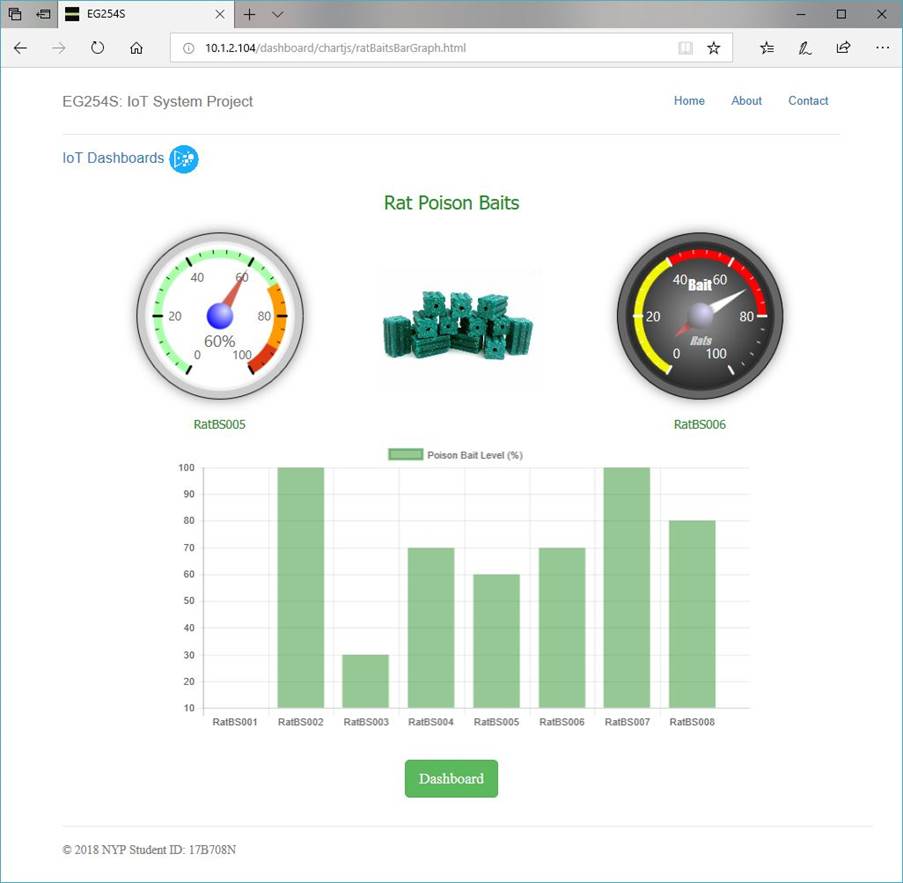
Create ratBaitsBarGraph.html file to Display the Rat Poison Bait Level Bar Graph
Again, create a new file inside chartjs project folder and name it ratBaitsBarGraph.html. This file is going to display the rat poison bait level bar graph.
File: ratBaitsBarGraph.html
Output
Conclusion
There we have our very own IoT dashboards showing the rat activities and the rat bait level using Bar Graphs. By clicking on the Dashboard button, we get the real-time data from MySQL database server on the Raspberry Pi. Using IoT platforms like the IoT dashboards, the pest control company can benefit from real-time insights and analytics, which would help them make smarter decisions.